
Photo Credit: Lucigerma / Shutterstock
Homeowners across the U.S. are facing mounting financial pressures as inflation has driven up the costs of essential goods and services, including housing. With home prices remaining near all-time highs, it is increasingly difficult for many households to afford their mortgage payments and property taxes. Rising insurance costs add further strain to this situation, stretching budgets thin and raising concerns about the sustainability of homeownership.
While the COVID-19 pandemic briefly shaped housing policy with protections like mortgage forbearance, the challenges homeowners face today are driven less by temporary disruptions and more by persistent affordability issues.
The housing market plays a crucial role in the broader economy, influencing consumer spending and financial security. As homeowners now face rising costs and financial pressures, these challenges could have far-reaching implications for economic growth and stability. With this in mind, researchers at Construction Coverage—a publication that provides data and research on factors that shape the construction industry—analyzed the latest data from the Consumer Financial Protection Bureau, Census Bureau, and Zillow to reveal the locations most affected by rising mortgage delinquencies nationwide.
Here are some of the key findings from the analysis:
- Post-Pandemic Reversal: After dropping to 1.39% during the COVID-19 pandemic, the 30-day mortgage balance delinquency rate surged to 3.68% in Q2 2025, exceeding pre-pandemic levels.
- Mortgages Dominate Household Debt: Mortgage loans account for over 70% of all U.S. household debt, totaling more than $12.9 trillion.
- All Debt Is on the Rise: Delinquency rates for all major loan types—including auto, student, and credit card debt—have now surpassed their pre-pandemic levels.
- A Geographic Divide: Southern states like Mississippi and Louisiana report the highest rates of missed mortgage payments, while West Coast states like Oregon and California have the lowest.
Composition of U.S. Household Debt
Mortgage loans account for more than 70% of all household debt

Source: Construction Coverage analysis of Federal Reserve Bank of New York data | Image Credit: Construction Coverage
As of Q2 2025, total mortgage debt in the U.S. stands at more than $12.9 trillion and accounts for more than 70% of the total debt held by U.S. households. Outstanding mortgage debt rose sharply during the pandemic—largely driven by below-average interest rates and elevated demand for housing—and it continues to rise to record levels in 2025.
Compared to mortgages, other consumer loan categories represent a much smaller proportion of total outstanding debt. Auto loans and student loans are the next largest loan types—each of which accounts for roughly 9% of total debt, or 18% combined. Credit card debt stands at approximately 6.6%, while HELOCs and other loan types comprise the remaining 2.2%.
Loan Balance Delinquency Rates (30+ Days) by Loan Type
Delinquent mortgage balances have been consistently rising after declining during COVID

Source: Construction Coverage analysis of Federal Reserve Bank of New York data | Image Credit: Construction Coverage
Data from the New York Fed highlights how COVID-era financial assistance programs like loan forbearance, direct relief payments, and enhanced unemployment benefits worked to stave off loan delinquencies. Over the course of 2020 and 2021 when these programs were in effect, the percentage of loan balances at least 30 days delinquent dropped to historically low levels across all major loan types. Delinquent mortgage balances, for example, experienced a substantial drop from a pre-pandemic rate of 3.50% to a low of 1.39% in Q3 of 2021. Similar trends were observed for credit cards, auto loans, student loans, and HELOCs to varying degrees.
Unfortunately, a combination of elevated interest rates and the end of most federal and state-level enhanced benefits programs has led to increased frequencies of missed payments, especially for student loans. As of August 2024, the Department of Education has ceased enrollment in any of the various student loan repayment relief programs, and the U.S. Department of Treasury began notifying defaulted borrowers of their repayment options—which could lead to wage garnishment if loan balances are not repaid—on May 5, 2025.
Although student loan delinquencies saw the most dramatic shift, loan balance delinquency rates for all major loan types have surpassed pre-pandemic levels. Delinquent mortgages are also on the rise despite many homeowners buying or refinancing before 2022 and locking in low rates. As of Q2 2025, the share of mortgage balances over 30 days delinquent has risen to 3.68%.
Geographic Differences in Mortgage Delinquencies
Southern states have the highest rates of delinquent mortgages

Source: Construction Coverage analysis of Consumer Financial Protection Bureau data | Image Credit: Construction Coverage
While mortgage delinquency rates are on the rise nationally, the concentration of delinquent mortgages varies significantly by location. In general, delinquency rates tend to be highest in areas with higher levels of unemployment and poverty, lower levels of income, and lower property values.
Regionally, states in the South and pockets of the East Coast tend to have the highest delinquency rates. For example, Louisiana, Mississippi, and West Virginia are the top three states for both 30-day and 90-day mortgage delinquencies. Other states with high rates of missed payments include Alabama and Texas. At the opposite end of the spectrum, the West Coast has the lowest share of mortgages more than 30 days delinquent, with Washington, Oregon, and California all reporting rates of delinquent mortgages under 2%.
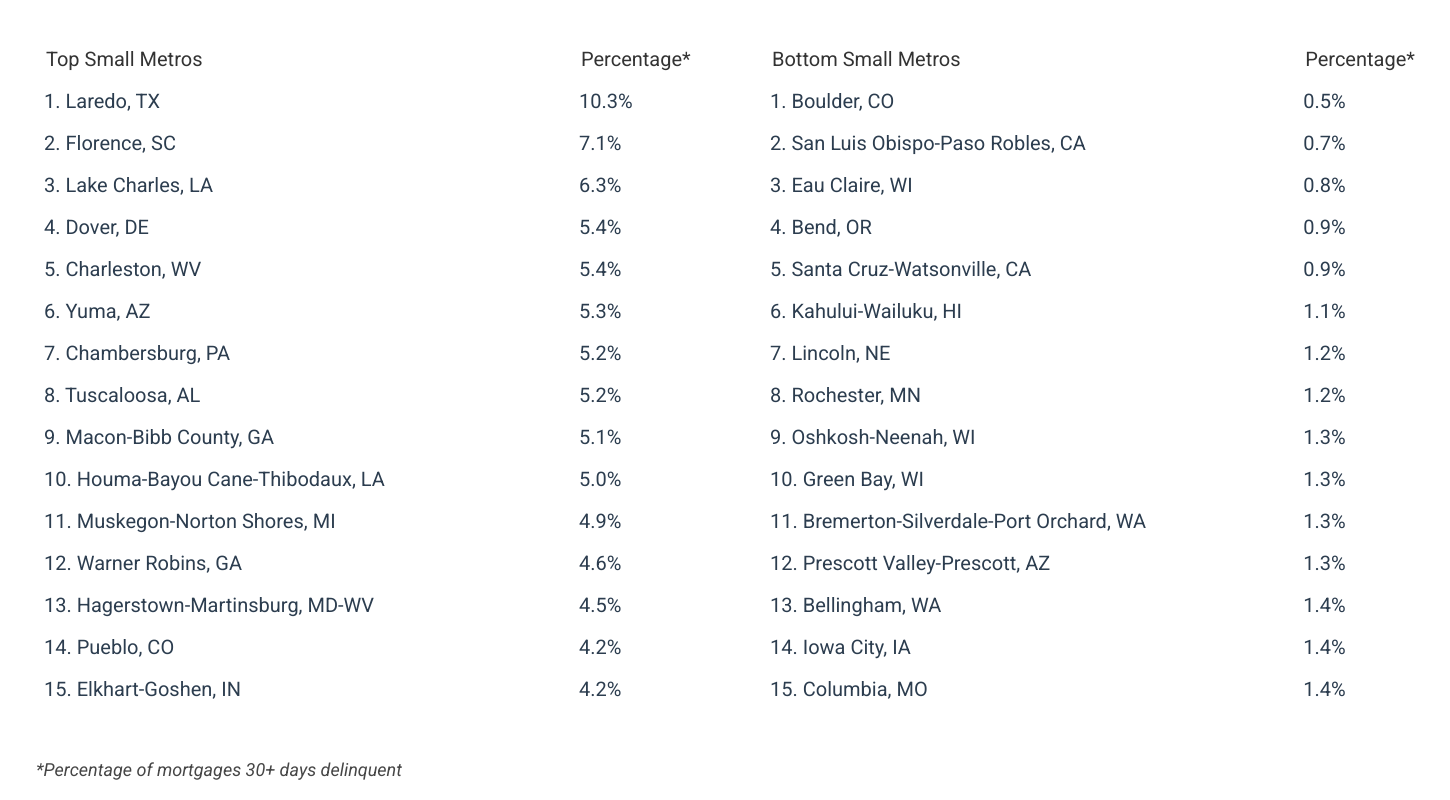
Similar trends hold at the local level with major metropolitan areas in the South—like San Antonio, Memphis, Houston, and Birmingham—reporting high rates. Residents in West Coast metros like San Jose, San Francisco, and San Diego, on the other hand, are far less likely to miss a mortgage payment.
The analysis was conducted by researchers at Construction Coverage, using data from the Consumer Financial Protection Bureau, U.S. Census Bureau, and Zillow. For a complete breakdown of mortgage delinquency rates across more than 260 metropolitan areas and all 50 states, see Cities With the Most Mortgage Delinquencies on Construction Coverage.
Cities With the Most Mortgage Delinquencies


States With the Most Mortgage Delinquencies

Methodology

Photo Credit: Lucigerma / Shutterstock
The data used in this study is from the Consumer Financial Protection Bureau’s Mortgage Performance Trends dataset, the U.S. Census Bureau’s 2023 American Community Survey 1-Year Estimates, Zillow’s Zillow Home Value Index (ZHVI), and the U.S. Bureau of Labor Statistics’ Local Area Unemployment Statistics. To determine the locations with the most mortgage delinquencies, researchers ranked locations based on the percentage of mortgages at least 30 days delinquent as of December 2024. In the event of a tie, the location with the greater percentage of mortgages at least 90 days delinquent was ranked higher. For additional context, researchers also included the average seasonally adjusted unemployment rate (as of July 2025), the median household income for 2023, as well as the most recent ZHVI.
For complete results, see Cities With the Most Mortgage Delinquencies on Construction Coverage.


